
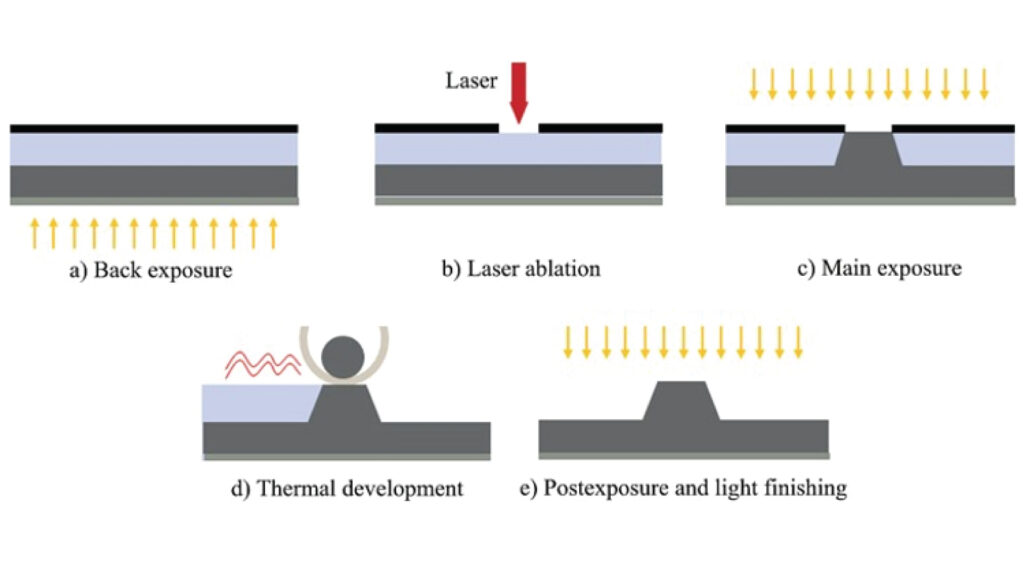
Back Exposure test
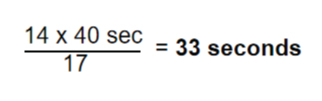
For Plate Thickness: 1.14mm – Backexposure time is 40 sec which is 14mW/cm²
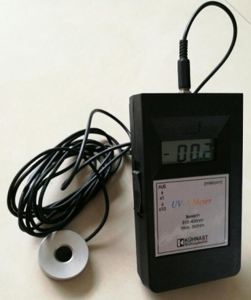
Example: If the UV-A lamps intensity measured 17mW/cm² with UV-A meter
2.Plate surface to identify in digital plates (which one is for the back exposure & main exposure)
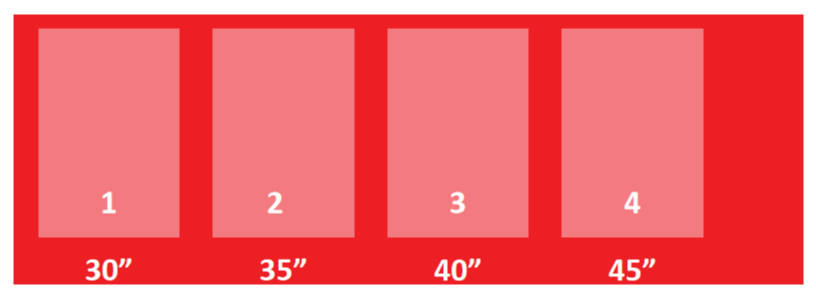
3.Plate back exposure test. (time in seconds)
Focus test:
1.Remove protective film or coversheet2.Mount on CTP Drum.
3.Focus test > The laser should stop upto the carbon mask.
Checking & measuring:
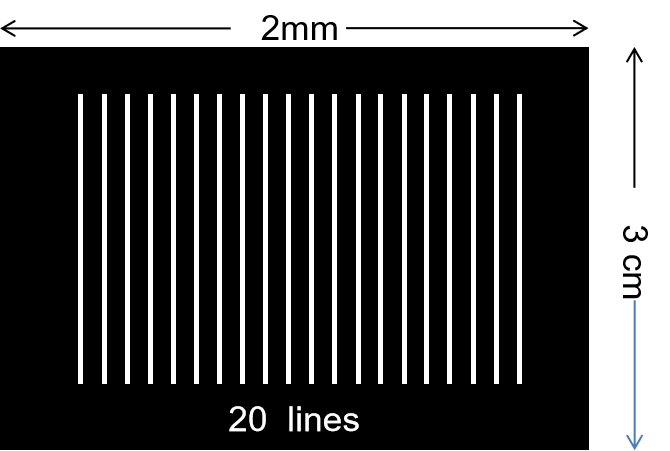
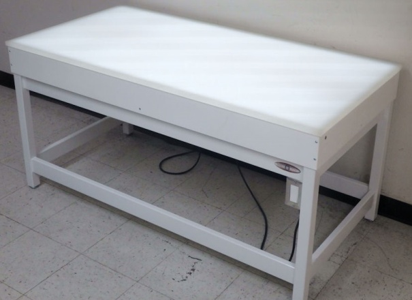
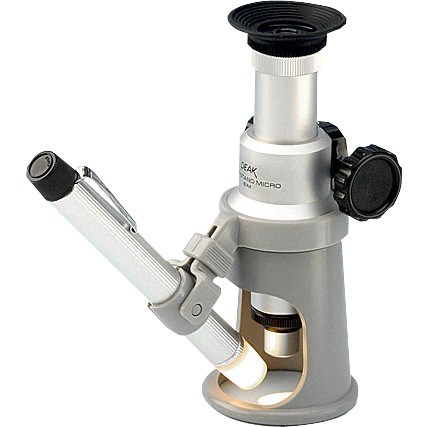
1.Put “ON” Light table and check with 100X magnification. (all the lines are in different thicknesses)
2.One line is thin—(check the thin one line)
3.Which is thinnest–count from the beginning upto the thinnest line.(example no.5 line is thinnest?)
4.Enter No.(5) in the screen for focus test.
Stain Test
Density
Like film, density values of the carbon mask play an equally important role. If a digital mask density is too low pin holing will occur (because not all light is being blocked by the carbon layer). Likewise, if the carbon mask has a high density it will prevent the laser from properly ablating the digital mask. If an area of a plate is not properly ablated it will hinder exposure causing malformed dots.
- Remove the Coversheet of the digital plate.
- Using a CALIBRATED Transmission Densitometer zero out the device to the raw photopolymer.
- Measure the digital plate (carbon side up) using the density function.
- The digital plate should read a value between 3.50 – 4.25. Because density is a logarithmic function the difference between a 4.25 and 4.3 is minimal.
- However, if you measure a 4.5 or higher take note.
1. Interval: Minimum 1 x per week& when visual inspection fails
Linearization
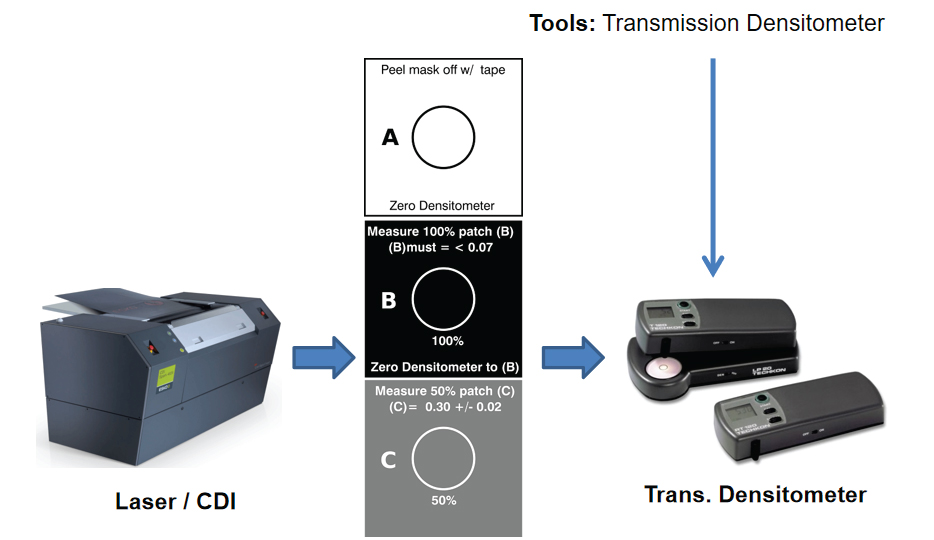
Linearizing (or calibrating) the ESKO CDI is done through a process called the Stain Test. Esko will provide all the tools necessary for this task minus the digital plate. There are two variables that can be changed to alter laser power Wattage and RPMs. Esko prefers to ablate at full power and alter RPMs. As well, consult the CDI manual to establish limitations of RPMs for plate gauges. (Thicker plates must be run at a slower RPM than thinner plates.)
- Mount a back exposed digital plate on the CDI.
- Find the test target provided by ESKO that has 50% tone and 100% tone.
- Ablate the target from 2.2 – 4.0 joules / cm² in increments of .2 joules/cm².
- Step and repeat each target 3 around the plate for a good sample variance.
- After ablating the test target, remove the plate from the CDI and take a piece of tape to remove a section of the Carbon Mask.
- Using a CALIBRATED Transmission Densitometer zero out the device to the raw photopolymer.
Measurement:
- 100% must be between 0,02 to 0,07
- 50% must be between 0,28 to 0,31
If suppose in 50% found the reading 0,33
Then to control Speed of drum: 700 rpm
Power of laser: 20 W (between 11 to 20 W)
New test: Speed of drum: 650 rpm
It is advisable to play with drum speed.
If suppose in 50% found the reading 0,26
Then to control the Speed of the drum: 750 rpm or 800 rpm.
BUMP CURVES
Good placemaking conditions, correct power settings, and bump curves will eliminate malformed highlight dots in plates.
- Using the established power settings for the Stain test, ablate the ESKO test target at the customer’s specified LPIs.
- Expose and wash out the ablated plate
- Allow the plate to properly dry.
- Using a100x power microscope on a clean light table note the formed dots for each line screen measuring .001” (through the backside of the plate).
- Apply the bumps to a newly created file.
- Ablate the new file and create plates with the same conditions to confirm a correct bump curve.
Flexo plate media generally have limited highlight resolution. Because halftone dots become smaller in highlight areas, a point is eventually reached where the halftone dots no longer develop properly. This is caused by insufficient UV energy reaching the plate.
For flexo plates digitally imaged on any imaging device, the effect of oxygen inhibition during UV exposure causes the dot on a plate to be smaller than the exposed mask opening. For instance, the size of the mask minimum dot may be equivalent to a 5% dot, but the size of the resulting dot on the plate may be as small as 1%, due to the effects of oxygen sharpening.
An experienced media representative must perform systematic exposure tests to establish minimum plate exposure values. It is not the responsibility of anyone specialists to determine minimum exposure values, but those values must be established before the Kodak specialist can proceed with implementing flexo screening.
Without a screening technology anyone, it is necessary to have a strategy for dealing with the values below minimum dot value. Traditionally, a bump curve is applied at the output to adjust values that are below the minimum dot to force the smallest halftone dots to print at the minimum dot value or higher.
About the Author:
Mohammed Abdul Haleem
Email: packagingprinting@consultant.com
With almost 27 years of experience in the printing industry, he offers proactive recommendations on anilox roll specifications, flexographic printing sleeves, testing, inventory management, flexographic equipment applications, training, representation from experience in technical sales, marketing, production, technical service, parts, and supplies. His experience covers the spectrum of flexographic markets including wide web flexible packaging, narrow web, tag & labels, foil, folding carton, corrugated packaging applications.